TallyPrime’s Business Owner Dashboard: The Numbers That Matter and Where You Can Find Them

Gaurav Singh Sehgal
Founder of Tally Home & Institute

TL;DR
TallyPrime’s Business Owner Dashboard brings essential business numbers, including sales, purchases, profitability, cash and bank balances, receivables, payables, and accounting ratios, onto one screen. With nine default tiles, customisable views, and drill-down reports, business owners can quickly identify sales trends, overdue payments, cash flow concerns, and profitability changes without opening multiple reports. By reviewing these metrics together and keeping accounting records up to date, owners can make faster, more informed decisions and stay in control of their business performance.
Introduction
A business owner does not need to open ten reports every morning to understand how the business is doing. TallyPrime’s Dashboard brings key information such as sales, purchases, profitability, assets and liabilities, cash and bank balances, receivables, payables and accounting ratios onto one screen.
The value of the Dashboard is not simply that it shows numbers. Each tile can be drilled down for detail, periods can be changed, and the underlying reports can also be opened independently through Go To.
Think of it as a business pulse check: useful for identifying where attention is required, followed by the detailed report when a decision needs deeper analysis.
What does TallyPrime’s Dashboard Tell a Business Owner Before the Day Starts?
Most business owners naturally watch one or two numbers very closely, usually sales and bank balance.
But those two numbers rarely tell the complete story.
- Sales may be rising while collections are slowing.
- The bank balance may look comfortable while large supplier payments are about to become due.
- Profit may be improving while too much money remains tied up in stock.
The TallyPrime Dashboard helps because it places different parts of the business next to each other.
To open it, press Alt+G (Go To), type or select Dashboard, and press Enter. It can also be opened from the Gateway of Tally.
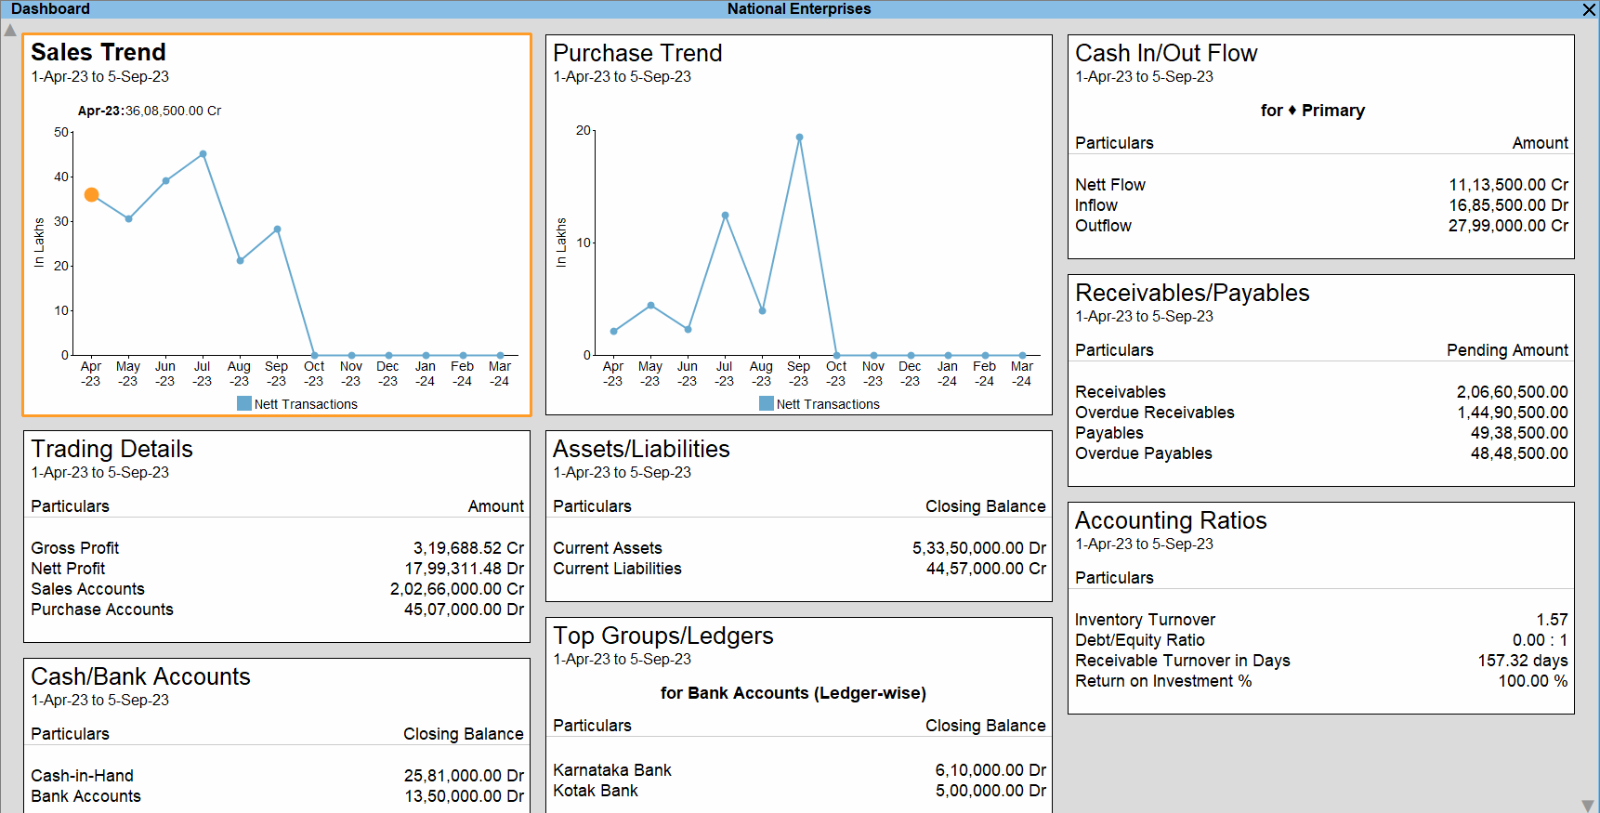
The default Dashboard contains nine tiles
Sales Trend
The Sales Trend tile shows how recorded sales are moving across periods.
For a business owner, the important question is not only whether sales increased, but how that increase developed. Was it gradual, seasonal, or caused by one unusually large month?
You can select a point in the graph and drill down into the information behind it.
For a more detailed sales analysis outside the Dashboard, press Alt+G → Sales Register. The Sales Register provides month-wise sales information and allows further drill-down into the underlying vouchers.
Purchase Trend
The Purchase Trend tile performs a similar job on the buying side of the business.
A rising purchase trend is not automatically good or bad. It may mean the business is preparing for stronger demand, buying stock in advance, or simply carrying more inventory than necessary.
This becomes more useful when Purchase Trend is read alongside sales and stock movement rather than in isolation.
For detailed purchase information, press Alt+G → Purchase Register. You can review purchases month-wise and drill down into the purchase vouchers for the selected period.
Trading Details
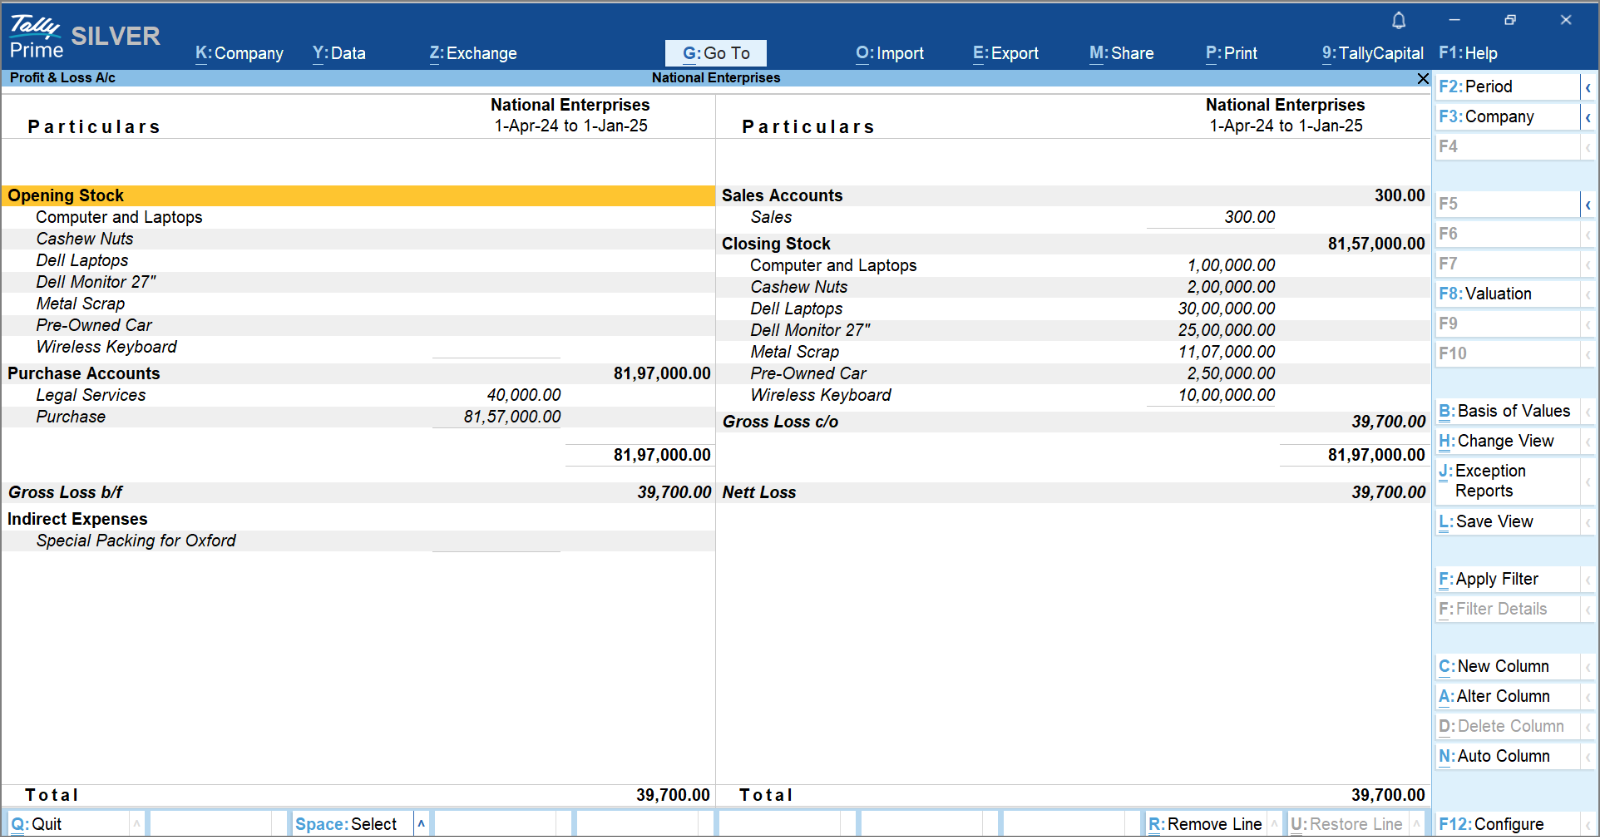
Trading Details brings together important figures such as sales accounts, purchase accounts, gross profit and net profit.
This helps answer a question that sales alone cannot:
Is the additional business actually improving profitability?
If sales are growing but gross profit is not keeping pace, the reason may lie in purchase costs, discounts, sales returns, product mix, direct expenses or stock valuation.
For deeper analysis, press Alt+G → Profit & Loss A/c and drill down into the relevant groups and ledgers.
Assets/Liabilities
The Assets/Liabilities tile provides a quick view of the financial position represented by assets and liabilities in the books.
For an owner, this is useful because business performance is not only about income and expenses. It is also about where funds are tied up and what obligations the business carries.
If liabilities are increasing faster than the assets supporting the business, the number deserves attention even when sales look healthy.
For the complete position, press Alt+G → Balance Sheet. The Balance Sheet allows you to drill down through asset and liability groups and examine their underlying balances.
Cash/Bank Accounts
This tile shows the closing balances of cash and bank accounts recorded in the books. It answers a simple but important question:
What do the books say is available right now?
But the figure should be treated carefully. An accounting balance is only as current as the entries behind it. Bank charges not yet recorded, receipts still awaiting entry, or instruments not yet cleared may create a difference between the book balance and the bank position.
For more detail, use Alt+G → Group Summary for Cash-in-Hand or Bank Accounts, or Ledger Vouchers when you want to examine transactions in a particular bank ledger.
Cash In/Out Flow
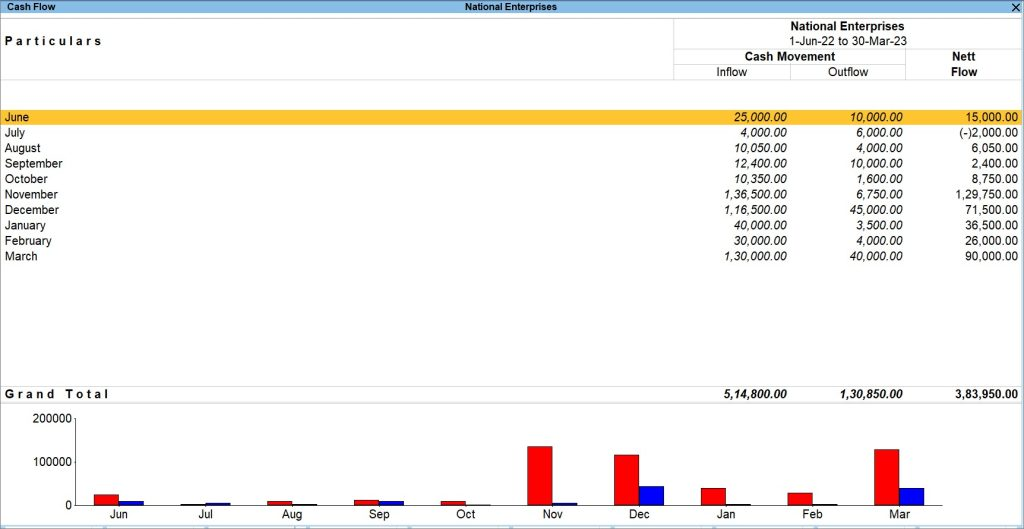
Cash/Bank Accounts tells you the balance. Cash In/Out Flow tells you the movement.
That distinction matters.
A business may have a reasonable closing bank balance but still be experiencing weeks in which payments consistently exceed collections.
The Cash In/Out Flow tile helps highlight those movements.
For the full report, press Alt+G → Cash Flow. The Cash Flow report lets you review inflows, outflows and net movement across the selected period.
Receivables/Payables
The Receivables/Payables tile brings four numbers together: total receivables, overdue receivables, total payables and overdue payables.
For many owners, this may be one of the most useful weekly tiles because cash pressure is often caused by timing.
The business may be profitable and still struggle if customers pay after suppliers need to be paid.
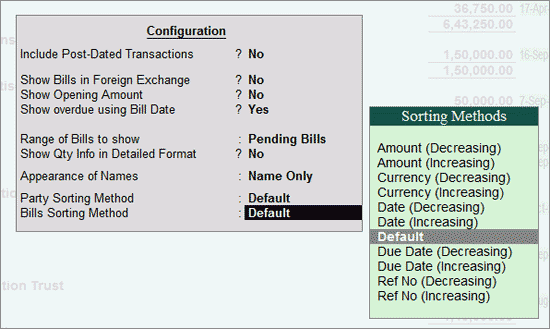
For invoice-level analysis, use Alt+G → Ledger Outstandings for a particular customer or supplier, or open the receivables and payables Outstandings reports. The Overdue by column, and F6 for age-wise analysis, show which bills are still pending and for how long.
Top Groups/Ledgers
Every business has concentrations that deserve attention.
A few customers may account for a large part of receivables. A particular expense group may be increasing quickly. One bank or ledger may carry a disproportionately large balance.
The Top Groups/Ledgers tile helps bring those concentrations to the surface without requiring the owner to inspect every ledger individually.
For further investigation, press Alt+G → Group Summary to examine a particular group or Alt+G → Ledger Vouchers to review the transactions of an individual ledger.
The purpose of the tile is not merely to tell you who is “top”. It is to tell you where you should look next.
Accounting Ratios
Accounting Ratios convert accounting balances into relationships that can be easier to interpret.
Depending on the available information, these may help an owner look at measures such as inventory turnover, receivable turnover, debt-equity position or return on investment.
A ratio should not be read without context, but it can be a useful warning sign.
For the detailed report, press Alt+G → Ratio Analysis. From Ratio Analysis, you can review individual ratios and drill down into the reports behind them.
Common Questions Business Owners Can Answer from the Dashboard
Once you understand what each tile contains, the real value comes from reading several tiles together.
Are Sales Growing, or Is the Business Just Busier?
A rising Sales Trend is a good starting point, but read it with Trading Details.
If sales rise by 20% but gross profit barely changes, the business may be working harder without earning proportionately more.
That should trigger questions around costs, discounts, returns, product mix and margins rather than an automatic celebration of turnover.
How Much Money Is Still With Customers, and How Much Do We Owe?
Receivables and payables should usually be reviewed together.
Three questions that are worth asking:
- Which customers account for most of the overdue amount?
- Which supplier payments become due before those collections are expected?
- Is the overdue number growing, or is the problem concentrated in the same few parties?
Before chasing a customer, open the underlying bills. Incorrect adjustment of a receipt or a disputed invoice can make an otherwise good customer appear overdue.
Is the Money Actually There?
Sales, receivables and cash are three different things.
- A sale says you have invoiced.
- A receivable says the money is still due.
- A bank balance says what has been recorded as available.
That is why Cash/Bank Accounts and Cash In/Out Flow deserve to be read separately from sales.
For a large payment decision, confirm the position against reconciled banking information rather than relying on the Dashboard alone.
Is Stock Supporting Sales or Locking Up Cash?
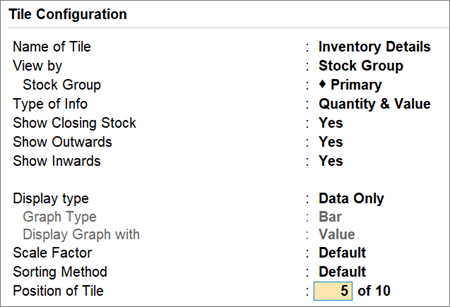
Inventory is not part of the nine-tile default view, but businesses maintaining stock can add an Inventory Details tile.
This can show closing stock information by stock group, including quantity and value depending on configuration.
The useful question is not simply, “How much stock do we have?”
It is:
Which stock is moving, and which stock is merely holding cash?
For detailed inventory analysis, open Alt+G → Stock Summary and examine the relevant stock groups or items
What Does a Five-Minute Monday Review Look Like?
Consider a simplified example.
A trading business opens the Dashboard on Monday morning.
- Sales are ₹12 lakh compared with ₹10 lakh in the previous comparable period.
- Receivables are ₹7.5 lakh, including ₹2 lakh overdue.
- Payables are ₹5 lakh, including ₹1.2 lakh overdue.
- Cash and bank together show ₹1.8 lakh.
The immediate conclusion should not be:
“Sales are up 20%, so everything is fine.”
The more useful conclusion is:
Collections and payment timing need attention this week.
That is what a good dashboard should do. It should tell the owner where to investigate next.
How to Set Up the Dashboard for Your Own Business?
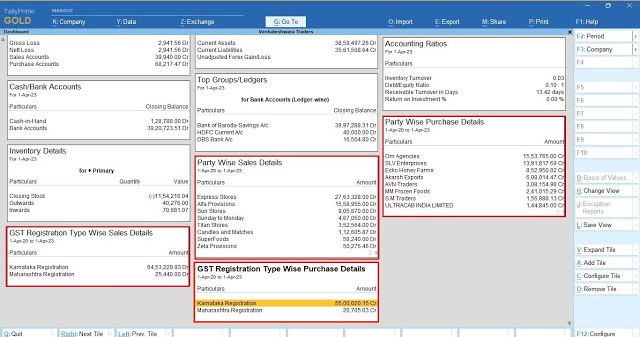
A Dashboard becomes more useful when it reflects the decisions your business actually takes.
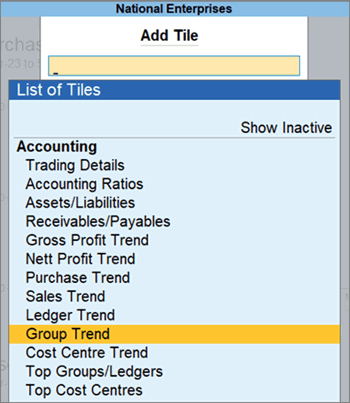
- Press Alt+A to add a tile, such as Inventory Details.
- Select a tile and press Alt+C to configure the information, display type and position.
- Press Alt+D to remove a tile that you do not need. It can be added again later.
- Use Ctrl+F2 to change the period for the complete Dashboard and F2 when you want to change the period of only one tile.
- Views can also be saved, and user access can be controlled through Alt+K → User Roles.
Fewer tiles often work better than more. Four or five tiles that regularly lead to a decision are more useful than a screen filled with information nobody acts upon.
What Does the Dashboard Not Tell You?
The Dashboard shows what has happened in the books. It cannot tell you about anything that has not been recorded yet. A supplier bill still sitting on someone's desk, goods dispatched but not yet invoiced, or a customer's payment that has not been entered will not appear on any tile, however recently it happened. If entries are posted once a week, the Dashboard is a week old in those areas.
It also cannot tell you why a number moved. The Sales Trend tile can show that a month was unusually strong, and Trading Details can show that gross profit did not keep pace, but the reason, whether a large one-off order, a discount given to a key dealer or a rise in purchase rates, only becomes clear when you drill into the vouchers behind the figure. In the same way, the Receivables/Payables tile shows what is overdue, but not which customer is likely to pay next week and which one has a dispute. That still needs a conversation, not a report.
Finally, the Cash/Bank Accounts tile shows book balances, not necessarily what the bank will honour today. Cheques deposited but not yet cleared, bank charges not yet booked and receipts awaiting entry can all make the two differ, so for a large payment the reconciled bank position is the safer figure. Period settings, tile configuration, inventory records and user permissions can also change what a particular person sees on the screen. For a major credit decision, a large supplier payment or a stock write-down, use the Dashboard to find where to look, then confirm the position in the detailed report.
Conclusion: Making the Dashboard Part of Your Weekly Routine
TallyPrime's Business Owner Dashboard is most useful when it is treated as a short, regular habit rather than an occasional report. Pick the four or five tiles that reflect how your business makes, spends and collects money, add an Inventory Details tile if stock ties up a large part of your working capital, and compare like-for-like periods before reading too much into any change.
The real value comes from reading the tiles together: sales next to profitability, receivables next to payables and cash, and stock next to how fast it is moving. None of this works without current books, though. A Dashboard built on entries posted a week late shows a week-old business, so the most important step is keeping sales, purchases, receipts and payments recorded as they happen. Done that way, a five-minute look on Monday morning tells an owner which question to ask this week, and the detailed reports are always one drill-down away when a decision needs them
Frequently Asked Questions
Do I need accounting knowledge to read the Dashboard?
No. The Dashboard uses familiar business terms such as sales, receivables, payables and cash, that is used in daily business. When a number appears unusual, drill into it or review it with your accountant.
Can I choose which tiles appear?
Yes. You can add, configure and remove tiles and save the Dashboard view that suits your business.
Does the Dashboard show overdue receivables and payables?
Yes. The Receivables/Payables tile can show total and overdue amounts, provided the underlying bill-wise information and due dates are properly maintained.
Can everyone in the office see every tile?
No. Access can be controlled through User Roles, including restricting particular tiles containing sensitive information.
How current are the Dashboard numbers?
The dashboard numbers reflect transactions already recorded for the selected period. Information that has not yet been entered into the books will not appear.
Can the Dashboard information be shared?
Yes. Dashboard tiles can be printed, exported, e-mailed or shared through supported options such as WhatsApp.
Originally published 21-11-2026

© Copyright 2026 tally home institute